
Went above and beyond to deliver high-quality work, and was quick to make adjustments when needed. Highly recommend and would definitely work with him again!
MOE Dashboards App
MOE Dashboards Real-Time Economic Data Visualization Platform
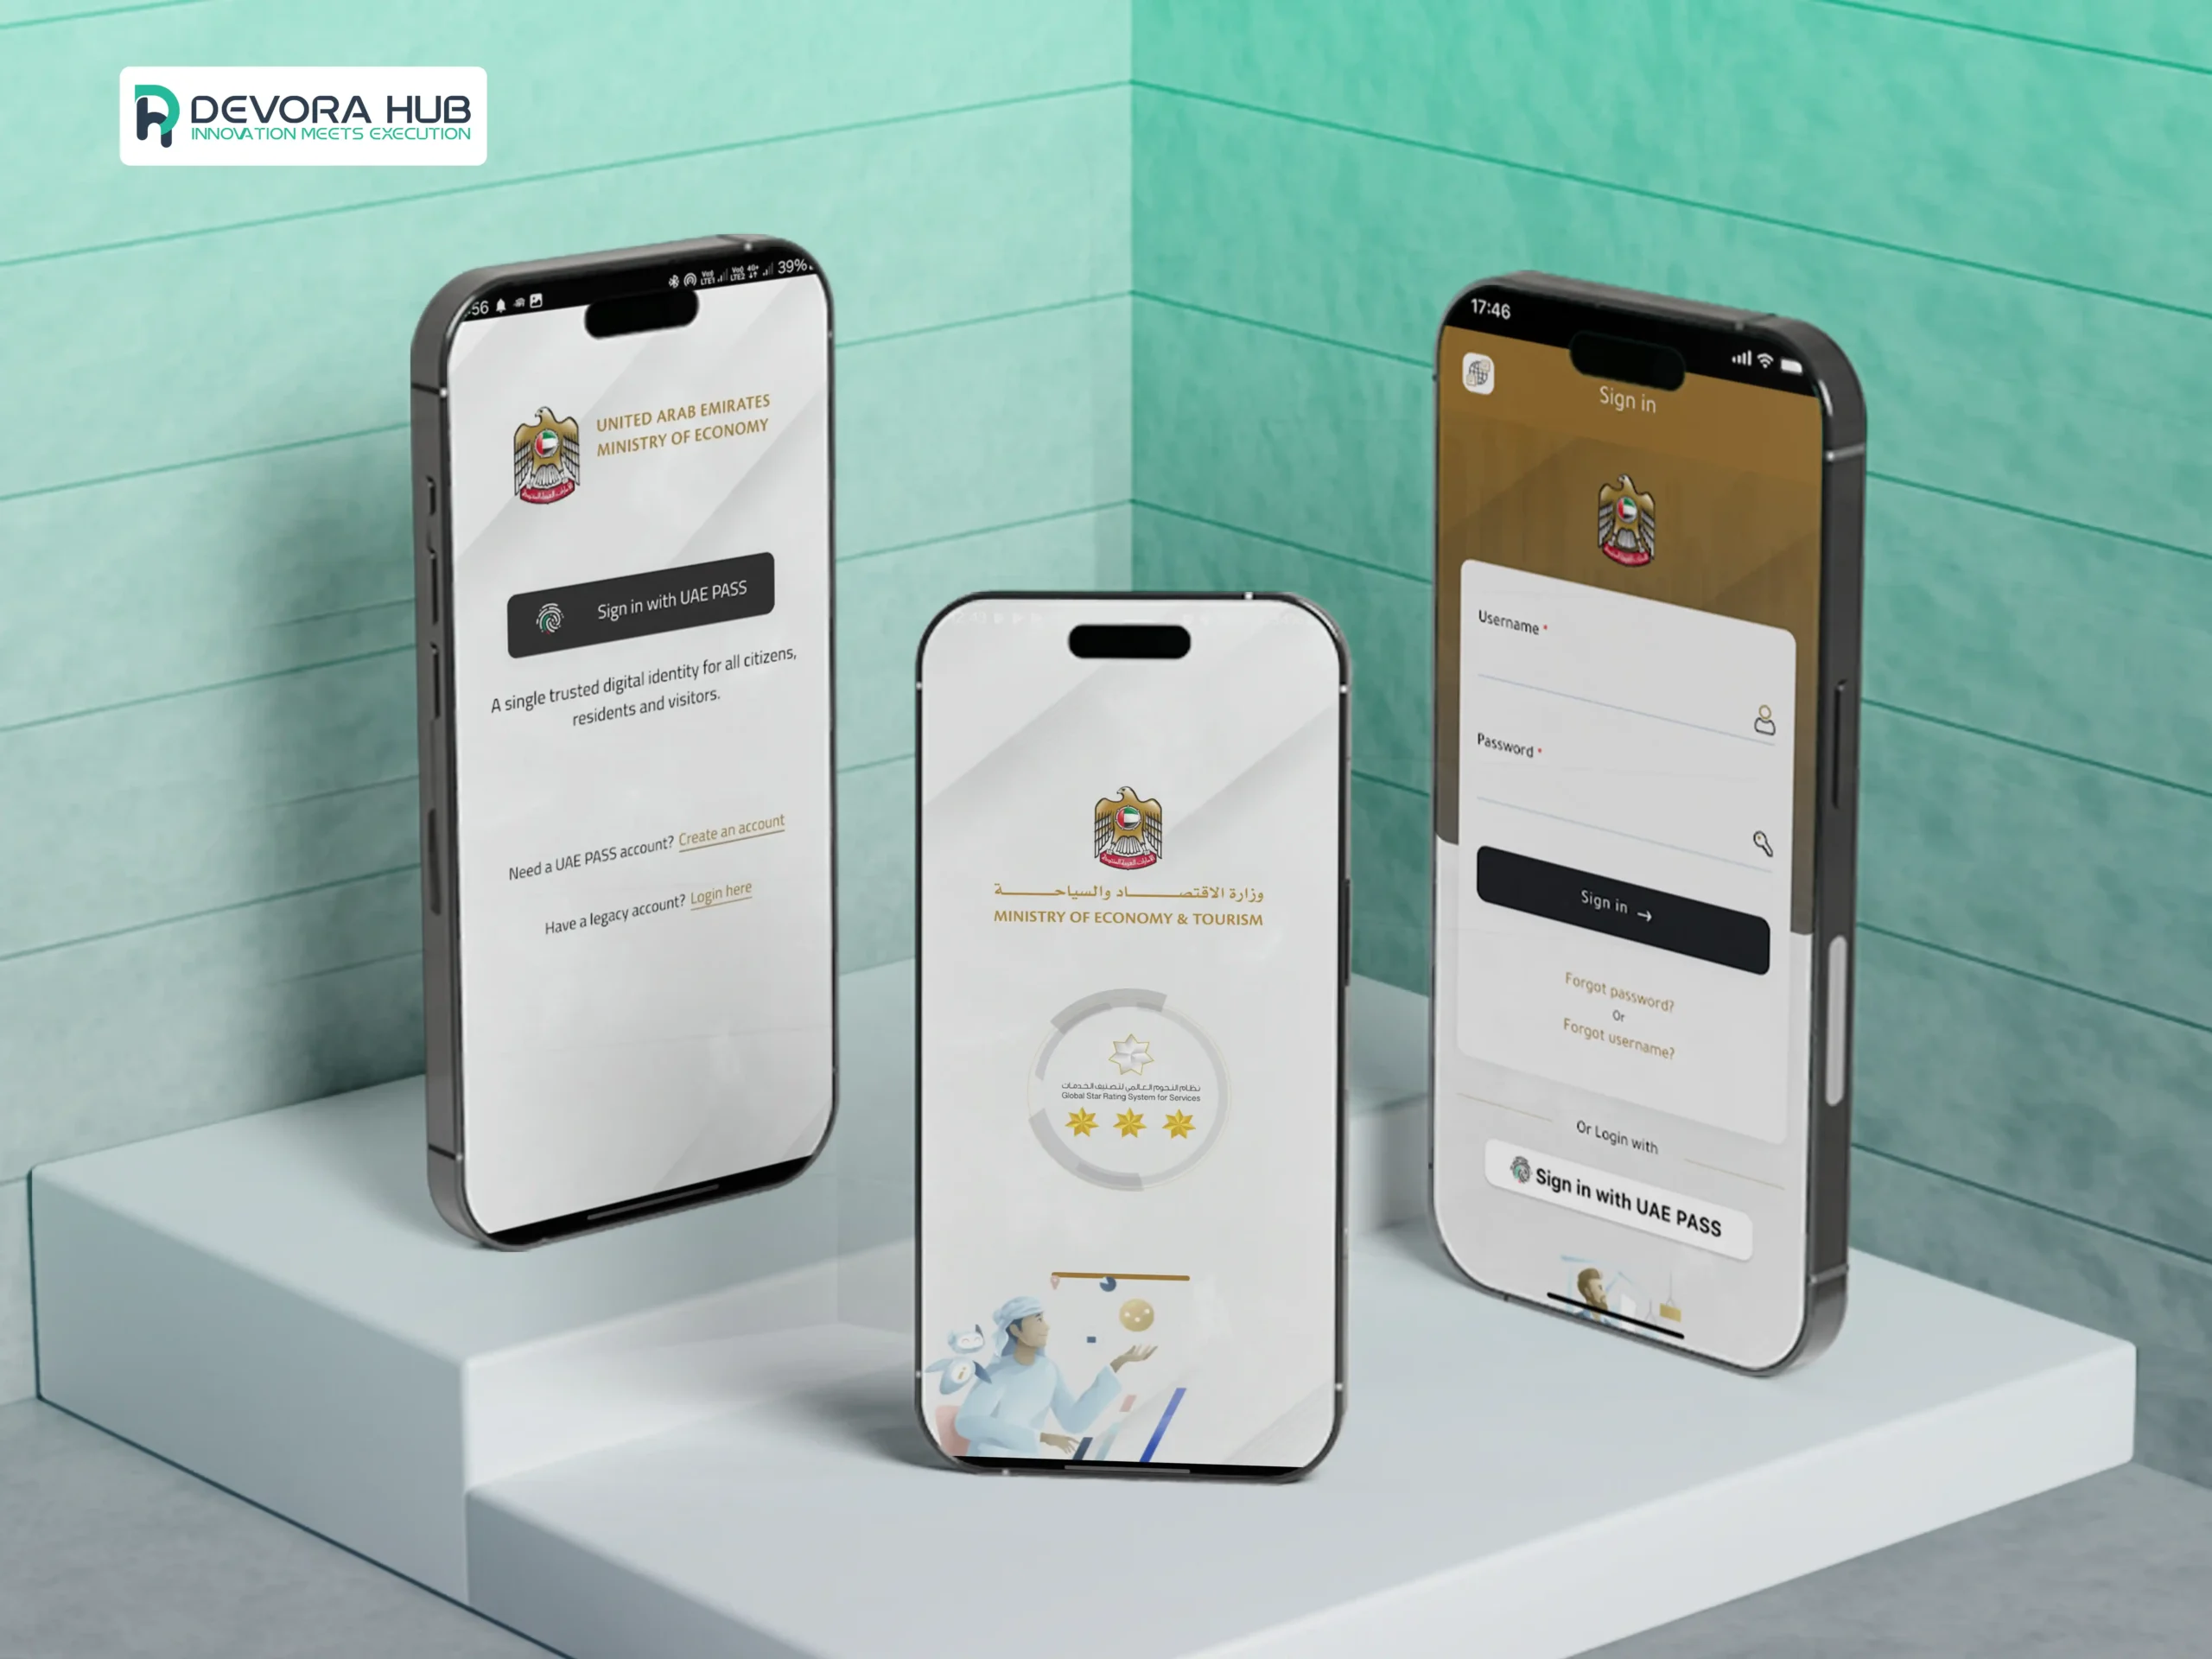
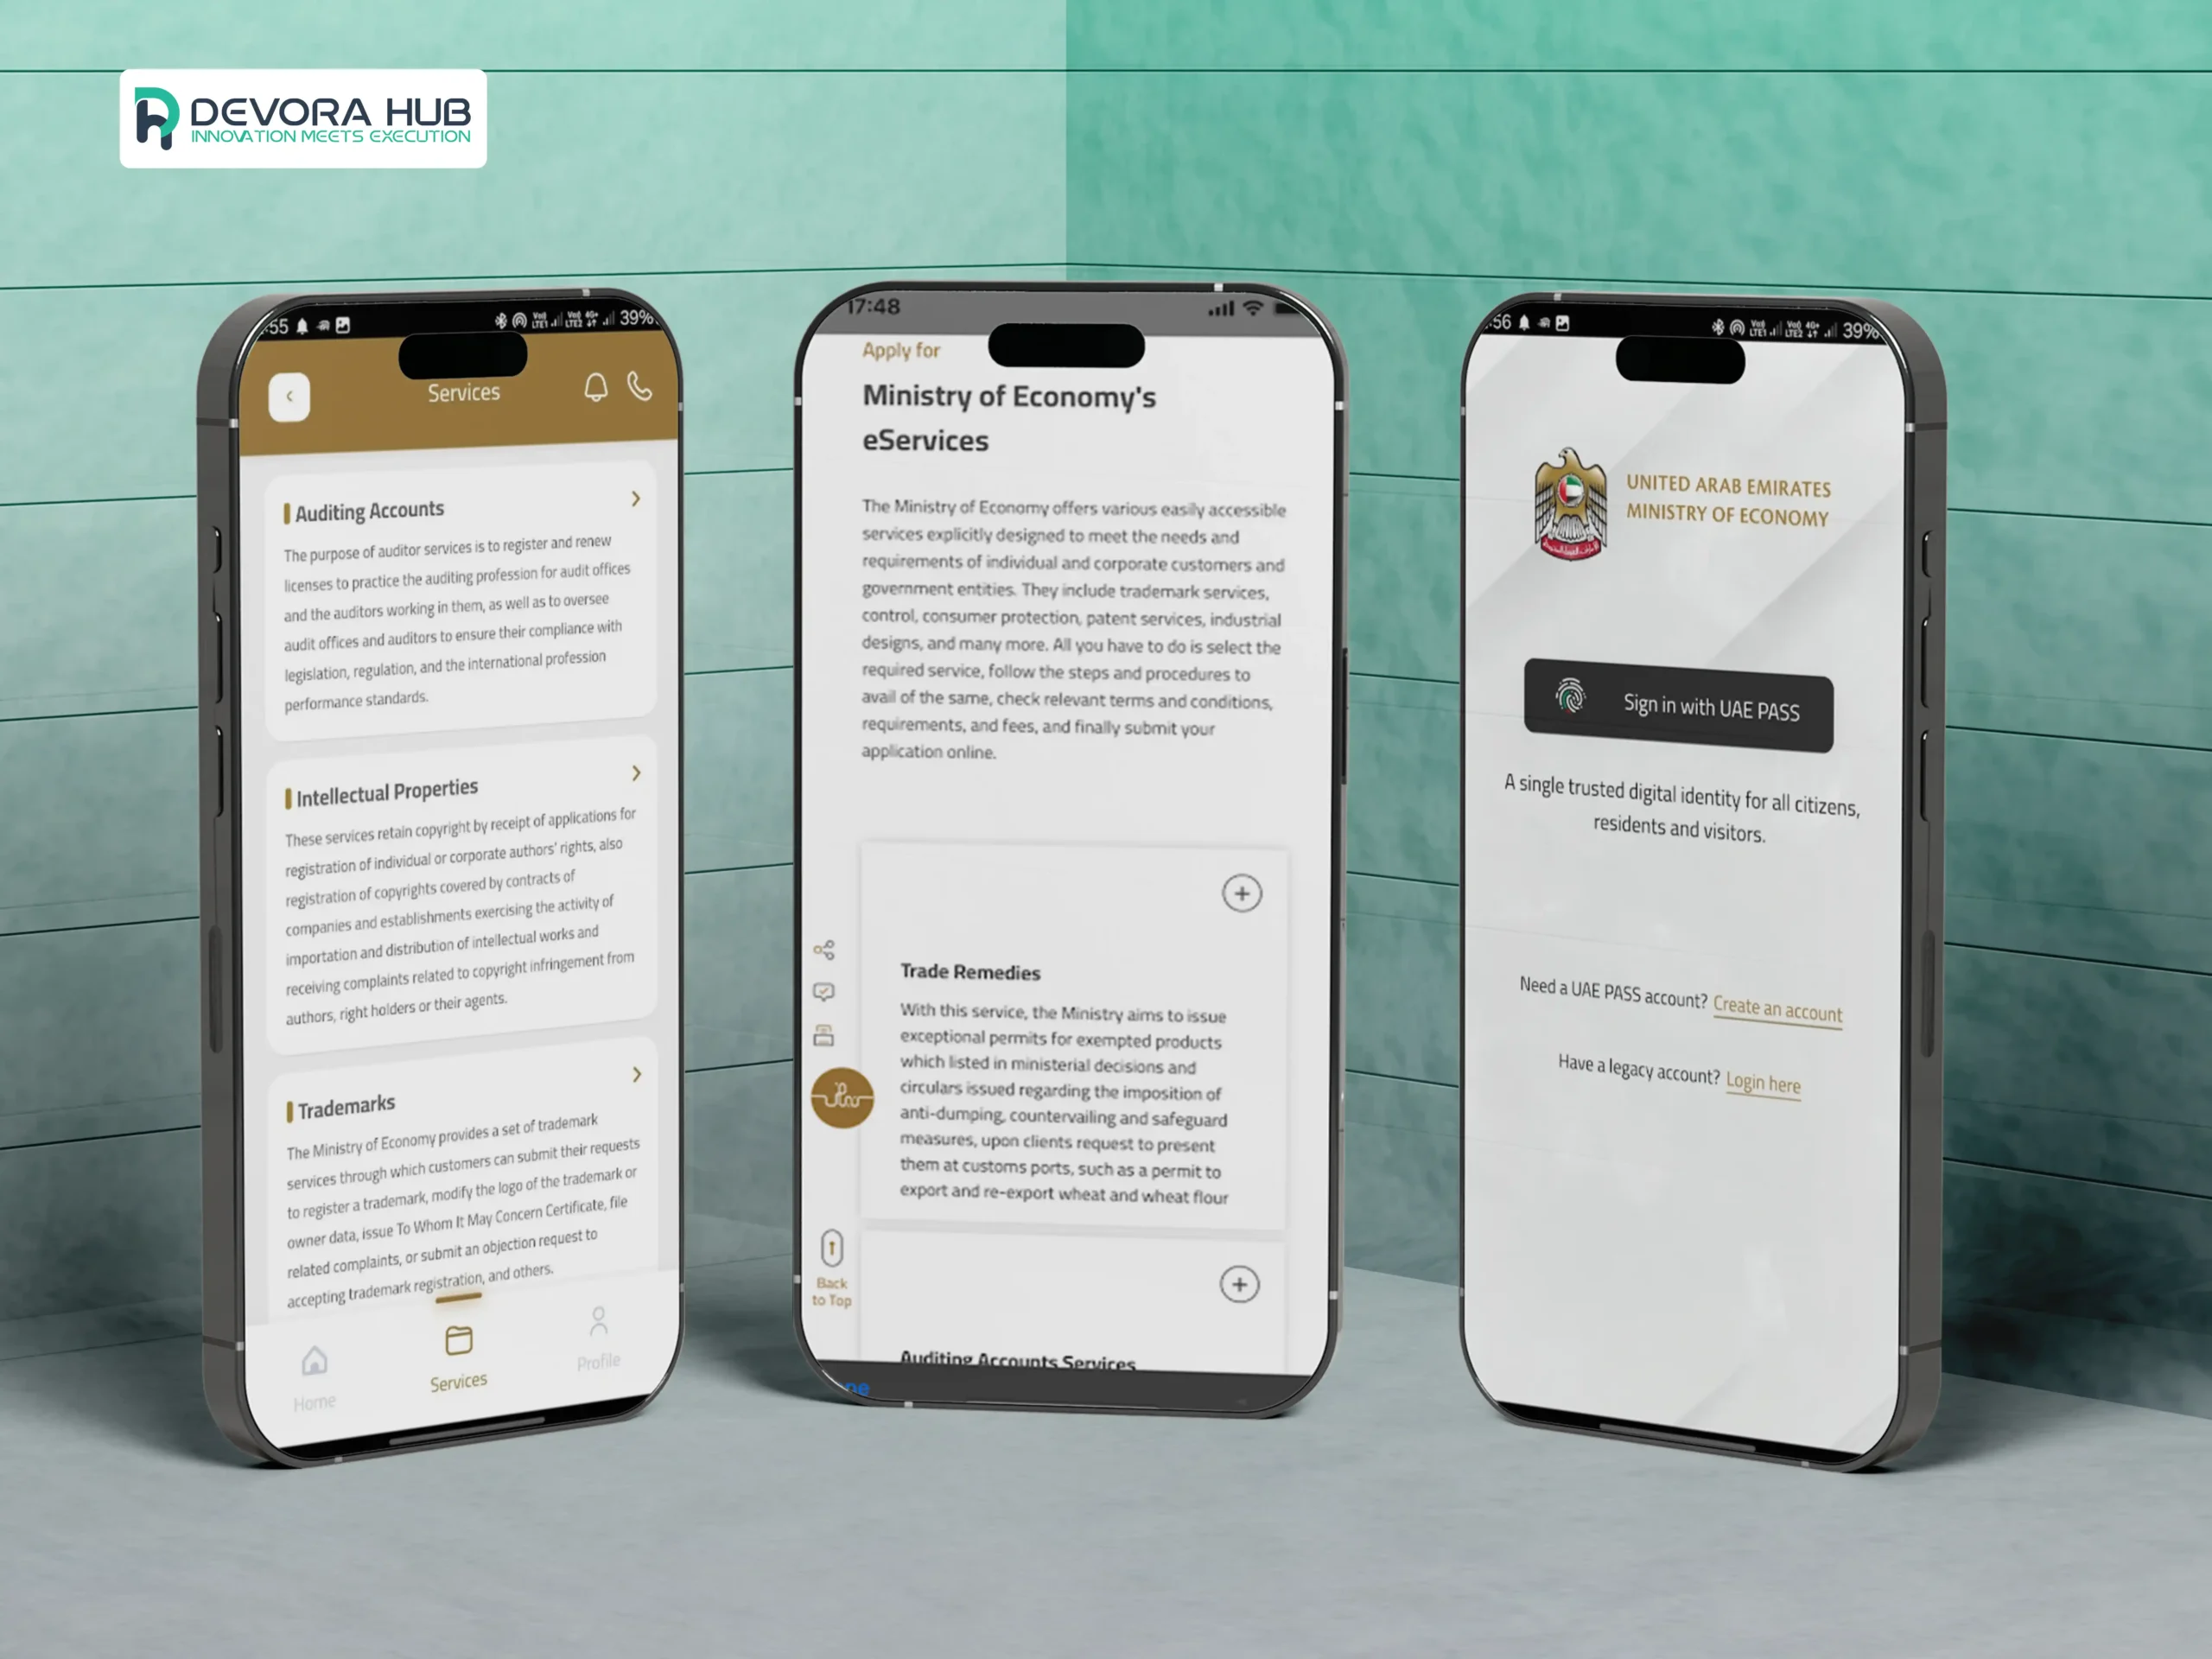
MOE Dashboards is a mobile-first data visualization platform designed to modernize economic monitoring and decision-making. Developed in partnership with Devora Hub, the solution was delivered within a rapid 40-day timeline. The platform enables ministries and private stakeholders to track macroeconomic indicators in real time. Interactive dashboards present complex economic data in a clear and actionable format. KPI-based tracking supports informed policy and business decisions. Automated reporting workflows reduce manual analysis effort. Multilingual support ensures accessibility for diverse user groups. Secure login and optimized backend processing enhance reliability. This project highlights Devora Hub’s expertise in building high-impact data analytics platforms.
Key Features Overview:
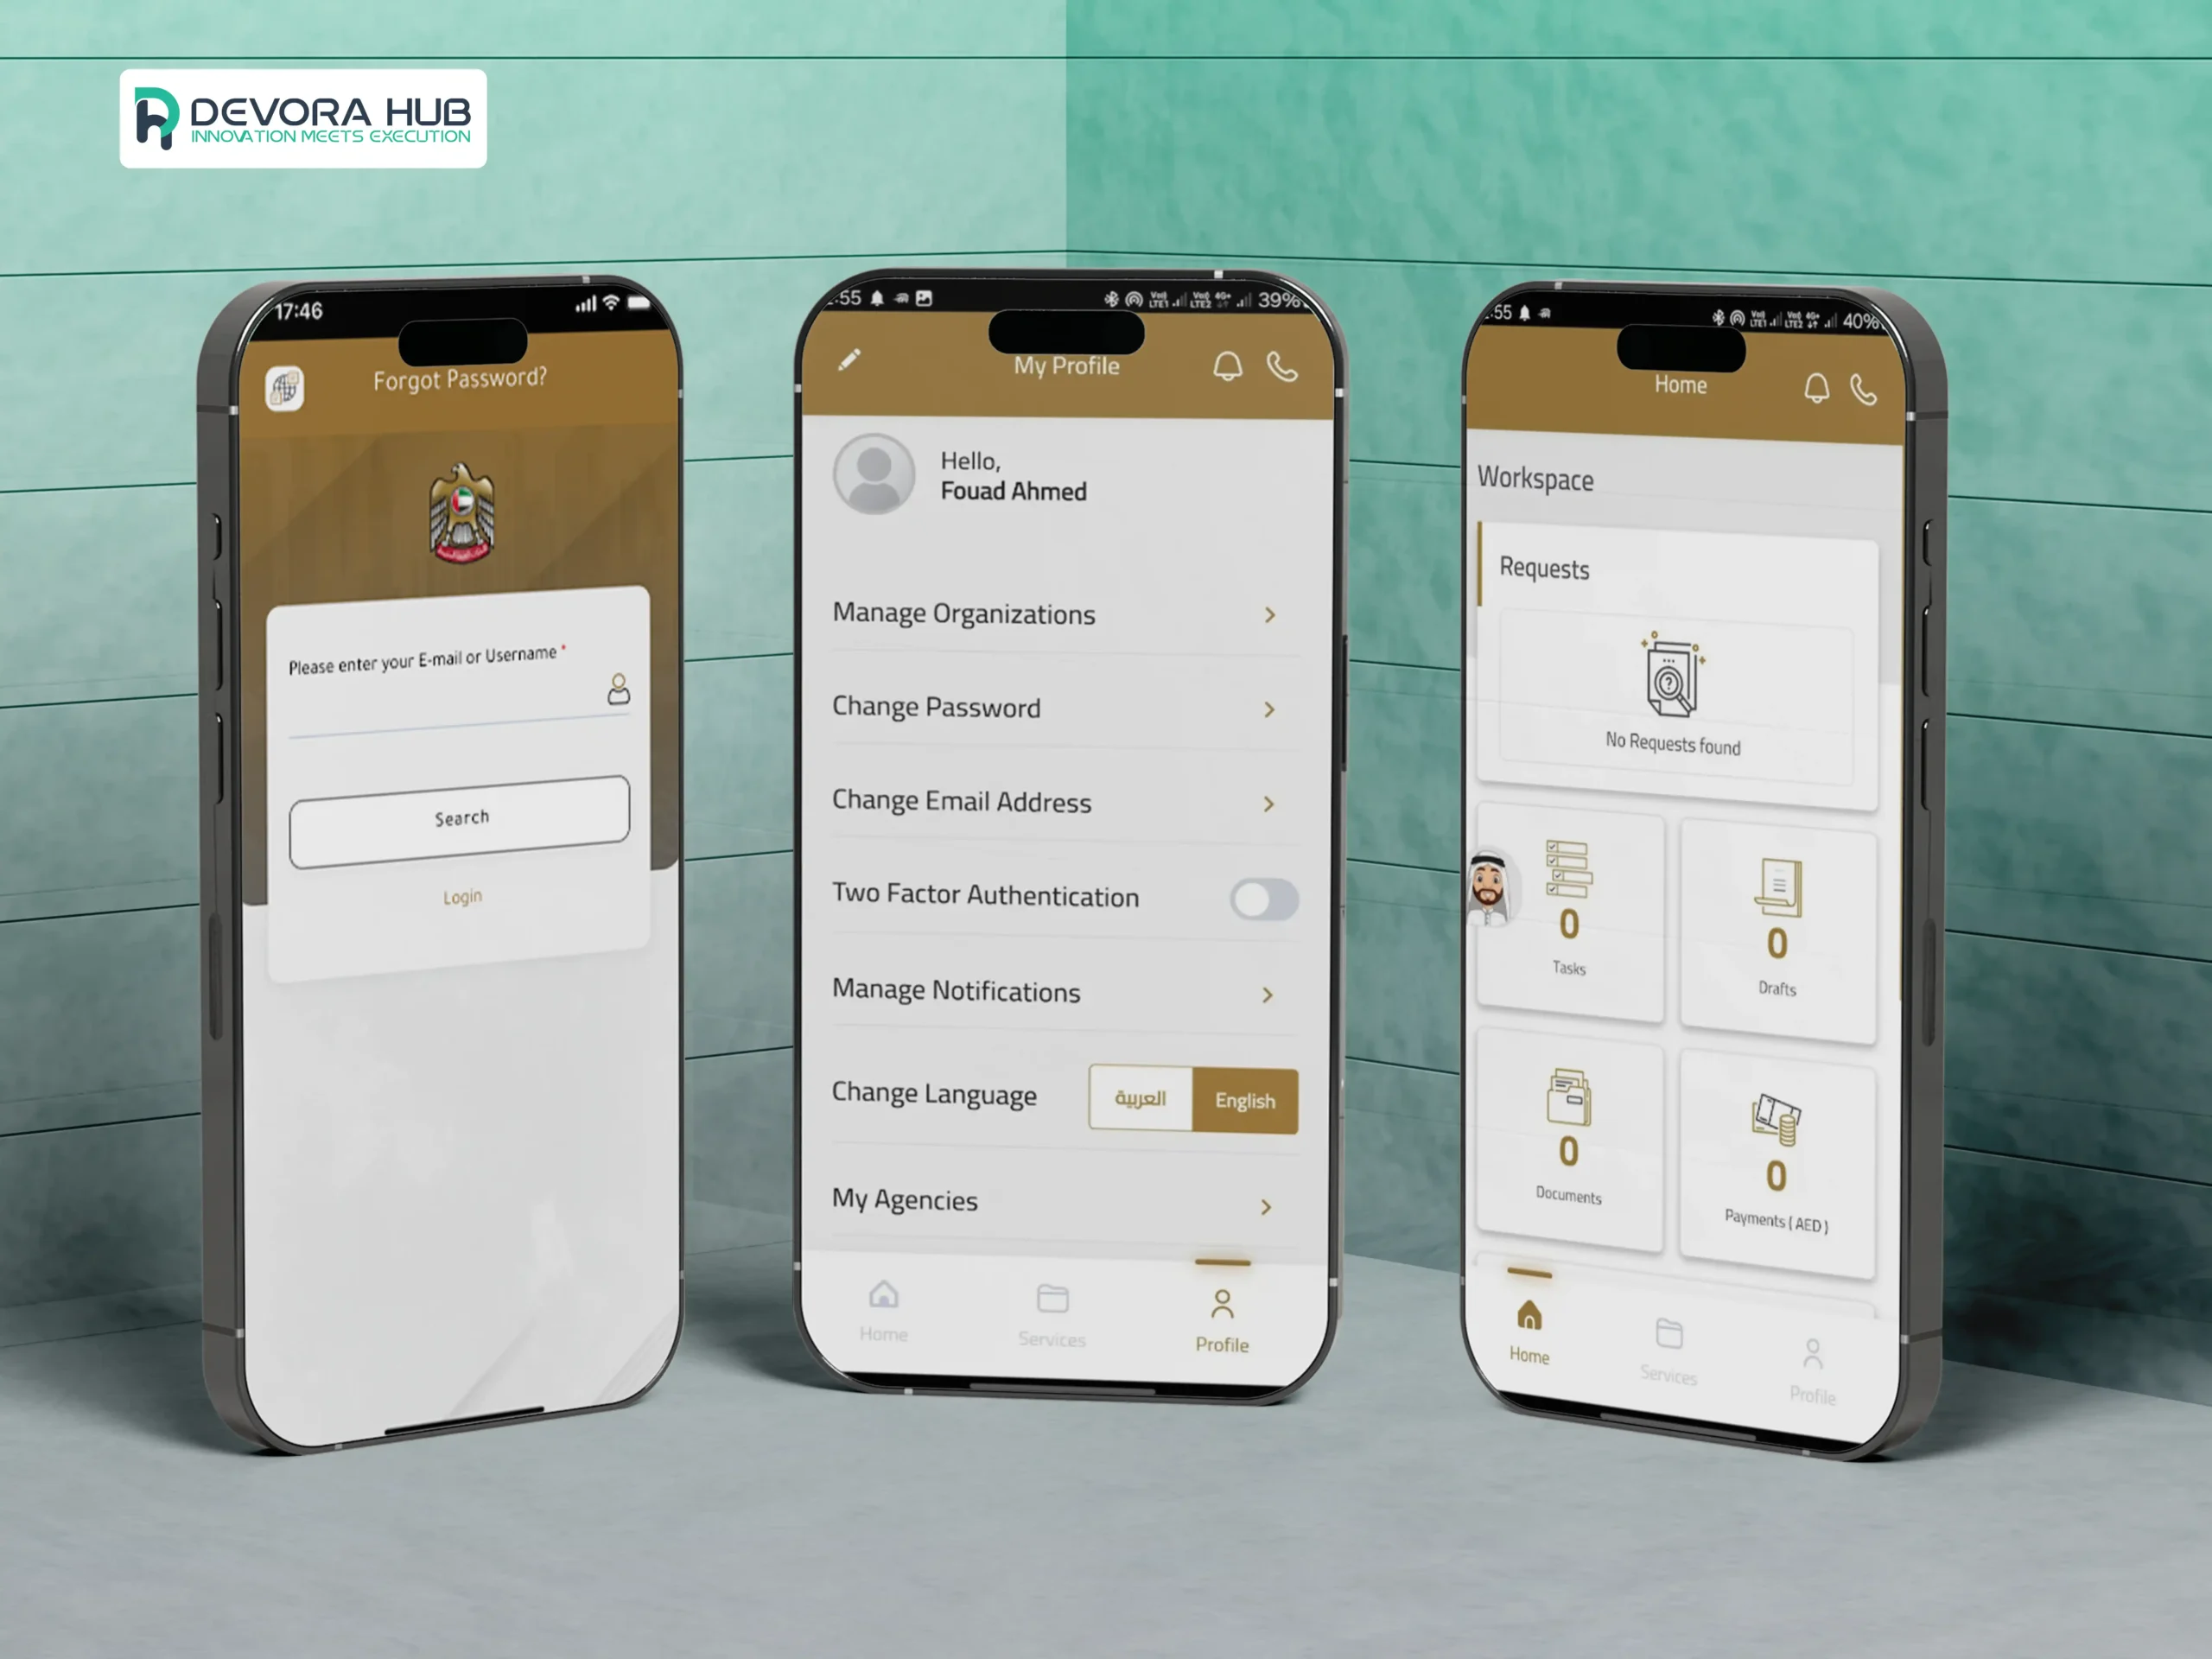
The platform provides a centralized system for economic data analysis. Interactive dashboards visualize key indicators clearly. KPI tracking supports performance monitoring. Automated reports streamline insights delivery. Multilingual interfaces improve accessibility. Secure authentication protects sensitive data. Modular dashboard components allow flexibility. Mobile-first design ensures usability on all devices. Scalable architecture supports future expansion.
- Interactive Dashboards
- KPI Tracking
- Real-Time Data
- Automated Reports
- Multilingual Support
- Modular Visuals
- Data Analytics
- Scalable Platform
By transforming raw economic data into clear visual insights, MOE Dashboards enables faster and smarter decision-making. The platform bridges the gap between complex statistics and strategic action through intuitive design and real-time analytics.
Delivering Secure Multilingual Economic Analytics Platform
- Rapid development timeline
- Data visualization clarity
- KPI accuracy alignment
- Multilingual UI support
- Secure system architecture
Improved Economic Insights and Faster Decision-Making
The MOE Dashboards platform launched successfully as a reliable economic monitoring solution. Users gained instant access to real-time macroeconomic insights. Decision-makers benefited from clearer KPI tracking and automated reports. Multilingual access expanded usability across regions. The scalable platform now supports ongoing enhancements and broader analytical use cases.
Clients Details
Government Analytics
Service Provided
Economic Data Dashboard App Development
Project Timeline
6 Weeks (40 Days)
Explore Other Categories

Highly recommend using this team for reoccurring work. They will always deliver above and beyond

“Bilal is great! Very responsive and attentive to details. He has great communication skills and experience with Brilliant Directory”

Dev Bilal delivered exceptional service with professionalism and efficiency! The project was completed flawlessly, and communication was top-notch. I’m thrilled with the results and highly recommend their expertise. Bonus points for offering additional services like SEO and app development, which I’m excited to explore. Will definitely work with Dev Bilal again!

“I absolutely loved working with bilal for GoHighLevel Leads, I was able to close a ton of clients because of the leads I received from him. I plan on working again with him in the near future. Great communiciation aswell!”